How much CO2 can you save when you remove ad-tracking from news sites?
Now that GPDR has landed, we're seeing companies serving EU specific versions of their site to EU users, which in some cases, serve a user experience which is cleaner, simpler and faster loading.
Some are much smaller over the wire too. So, because moving data uses servers,and those servers use electricity, and that electricity usually comes from burning coal, I've had a go at doing some basic calculations to work out what the CO2 reductions might be if these became the norm.
TLDR - For a site like USAtoday, it looks like running the 'GPDR-lite' version as the default would represent CO2 emissions savings equivalent to an entire European persons's annual carbon footprint, each month.
How I arrive at these numbers
I need to stress right at the beginning - these figures I'm about to share are very rough, and I don't pretend that they're in any final, accurate form at all.
I'm hoping to share this to help get a better idea for how you might work out the CO2 emissions associated with transferring data in a more rigorous fashion, but also because I think these emissions are worth discussing, and I can't find any numbers like this online yet.
First, our smaller site:
Let's take Hadley's tweet here - she's referring to a the EU specific version of the USA Today site, which is about 500kb, compared to the full size, ads and tracking site which weighs in at 5mb site instead:
https://twitter.com/hadleybeeman/status/1000435217109278721
What kind of energy footprint does this represent? Let's take a rough estimate of the total daily traffic for the USAToday from EasyCounter (we could use Alexa if we wanted to pay for more accurate traffic results)

Looking here, we get 3.77 million daily page views.
So, if we wanted an idea of daily bandwidth, we might multiply page size by daily page views.
So, lets take a 5MB page, and multiply it 3.77 million times to represent the page views.
This gives us a figure, that, when we round it to the nearest one hundred gigabytes, is about 18,400 gigabytes of data per day.
How much energy is that?
Now, it's been really hard to find reliable numbers to convert bandwidth to energy usage when I've looked before, but the best freely available figures I've found are from work I found via Jonathan Koomey's blog, where he shares something like this:
This article derives criteria to identify accurate estimates over time and provides a new estimate of 0.06 kWh/GB for 2015. By retroactively applying our criteria to existing studies, we were able to determine that the electricity intensity of data transmission (core and fixed-line access networks) has decreased by half approximately every 2 years since 2000 (for developed countries),
So, this is semi-throwaway blog post and it's a Sunday, and so for the purposes of getting a ballpark figure, I'm going to cheat and just project forward two years to 2017, and say 2018 is close enough to 2017 for me to use 0.03 kWh/GB.
Okay, how much carbon dioxide is that?
For a ballpark figure like this, we'd take the total energy needed to transfer our 18,400 gigabytes per day, then multiply that by our 0.03 kilowatt hours per gigabyte, then multiply that by the CO2 emissions per kilowatt hour.
Let's get our CO2 per kilowatt hour figure so we can do this
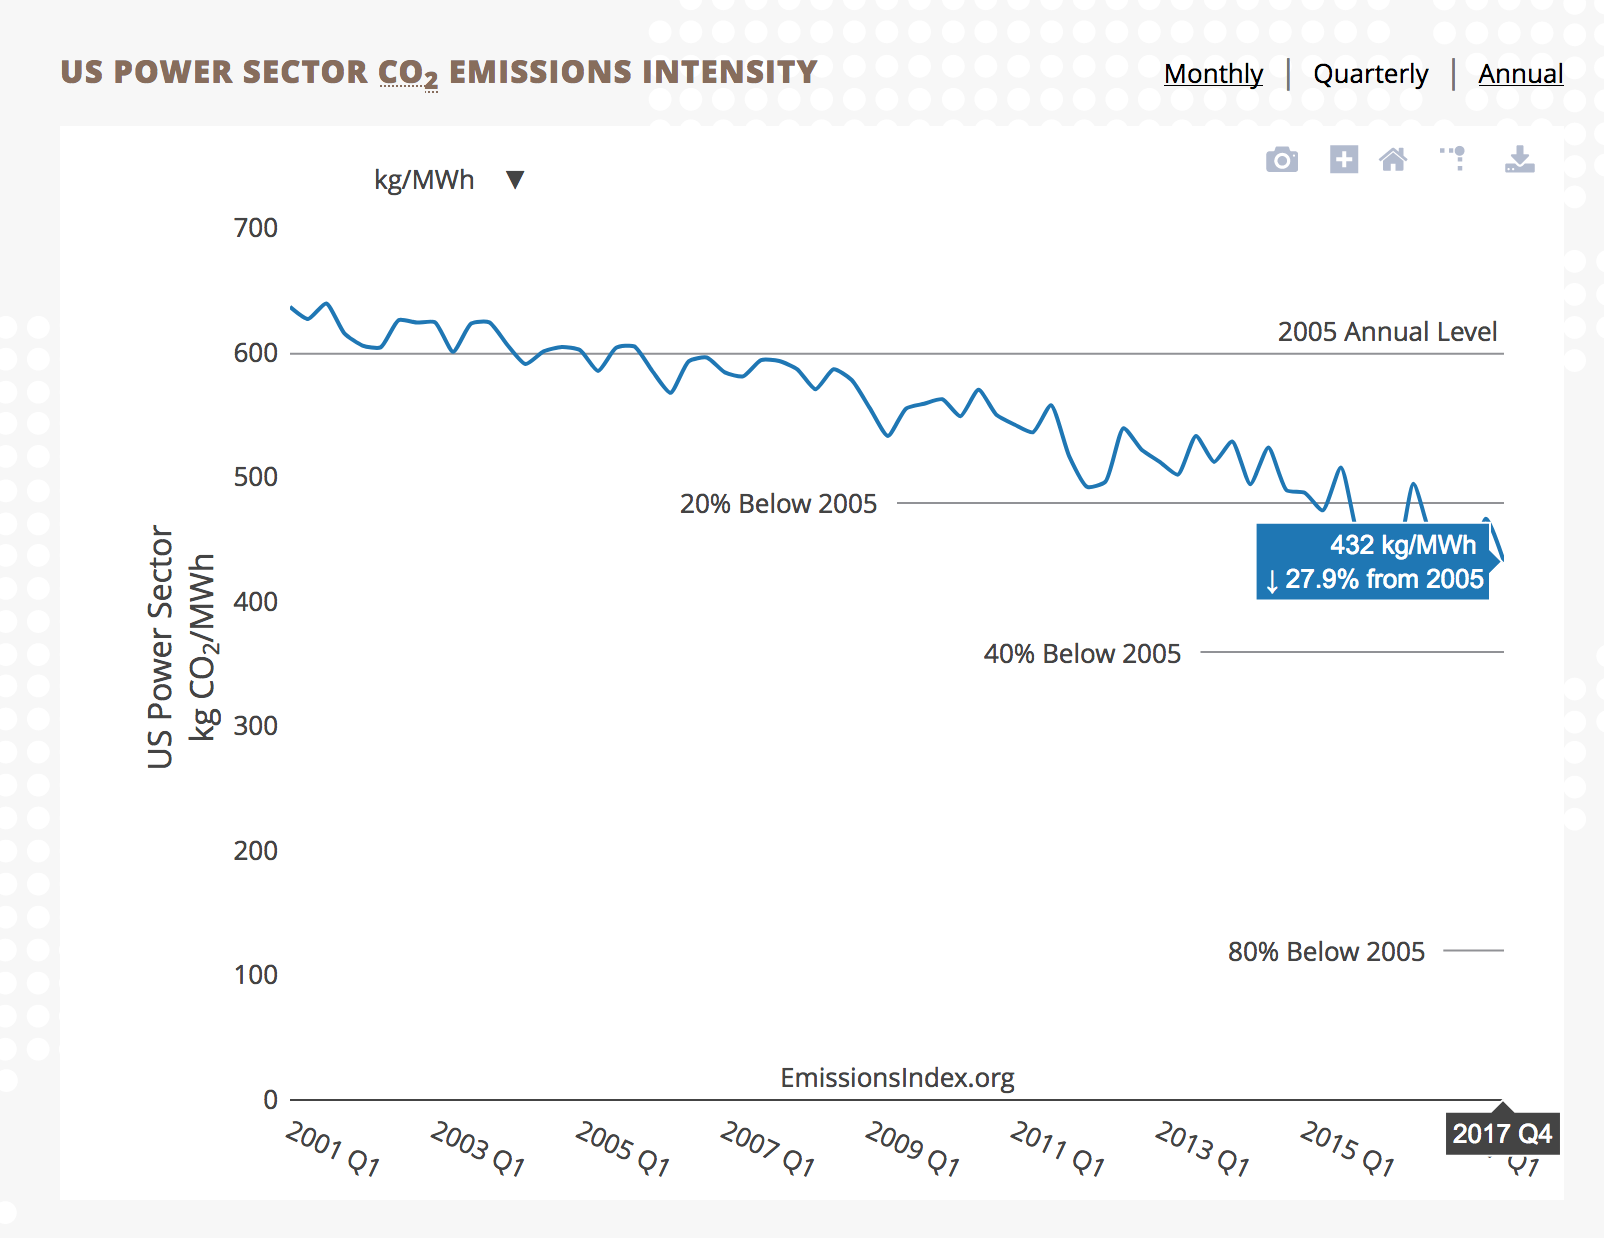
In the US, where most of the USAToday audience is likely to be, a fair amount of coal is used to generate power, so when I was dumping some numbers into this jupyter notebook, I made a guesstimate figure of 0.45 kilograms of CO2 emitted per kilowatt hour of electricity generated.
After checking it against the emissions index website to check against some actual numbers, it turns out I was off, but not that far off.
Their figure is 432 kilograms per megawatt hour, which is about 0.43 kilograms of CO2 per kilowatt hour.
I've been rounding at each stage here, to make it a bit easier to keep the numbers a bit easier to remember.
However, I'm going to pull the actual number from the jupyter notebook, which when rounded again, gives us 248.5kg of CO2 per day, or a little under 7.5 tonnes per month more or less.
Translating this into something more tangible
If we had the lighter, GPDR friendly, ad-and-tracking-free version of the site as the norm, if we just looked at the bandwidth savings, then we'd be saving something like the annual carbon footprint of a typical European, according to the World Bank, every month.
Or if you prefer, something like a flight between New York and Chicago every day.
If this is interesting to you, there's some more in this jupyter notebook on github.
Plug time - the planet friendly web guide
I'm looking for people to work with and explore this kind of stuff with me.
Why?
Well, I work in tech, and it seems like loads of our existing tools, and practices can be re-purposed to bring about reductions in CO2 emissions in our industry AND make the digital products we create work better for our users.
If you design infra for services,where you source power, and how you provision your resources, to match your use (i.e. scaling) has an impact.
If you design clients, or apps, then how send data over the wire has an impact (i.e. WPO, et al).
If you design the business model, or how you get feedback from stakeholders, or how you travel to do all this, then decisions you make here have an impact too.
Let's chat
If this is interesting, please do get in touch, as I'm trying to:
- get a free, open source guide together around the subject at planetfriendlyweb.org
- prototype a workshop (one remote, one in Berlin), to help organisations identify where they can make these reductions (and usually, save money or reduce waste along the way)
My contact page lists the usual ways to reach me, and if the guide seems fun, there's a contributor page there too. T